The Squeezed Middle: Escaping the Zero-Interest Capital Trap in South African Jewellery Retail
A Coetzee Convergence Framework Analysis of the R5,000–R50,000 Market Segment
Introduction: The Affordability Illusion
The middle-market jewellery sector—defined by purchase values between R5,000 and R50,000—represents the most strategically treacherous terrain in South African retail. This segment encompasses the majority of lifetime jewellery purchases: engagement rings, wedding bands, anniversary gifts, milestone celebrations, and aspirational self-purchases. It is where emotional significance intersects with genuine budget constraints, creating a psychological battleground that retailers have historically addressed through affordability engineering—the practice of making premium products appear accessible through payment term manipulation.
The dominant affordability mechanism in 2026 is zero-interest financing, marketed under various brand names: ZIP, Payflex, LayBuy, and proprietary in-house payment plans. The value proposition appears compelling: a R30,000 engagement ring becomes “only R2,500 per month for 12 months with no interest.” The customer perceives this as financial alchemy—premium goods at accessible monthly commitments. The retailer perceives it as competitive necessity—refusing zero-interest terms means losing sales to competitors who offer them.
Both perceptions are catastrophically wrong.
Zero-interest financing in the middle market is not a customer service; it is a capital destruction mechanism that systematically erodes retailer profitability while creating adverse selection dynamics that compound over time. This essay examines the economic physics of this trap, the psychological dynamics that sustain it, and the architectural corrections required to escape it while maintaining competitive viability in the squeezed middle.
The thesis is unambiguous: the middle-market jewellery retailers who continue competing on payment term generosity will face structural insolvency by 2027-2028. Those who pivot to transparent value architecture with disciplined capital deployment will capture disproportionate market share as competitors collapse under the weight of their own financing portfolios.
Part 1: The Economic Physics of Zero-Interest Financing
The True Cost of Capital Lock-Up
When a South African jewellery retailer offers 12-month zero-interest terms on a R30,000 engagement ring, they are executing a transaction with hidden complexity that most operators do not fully comprehend. The surface-level understanding is accurate but incomplete: the retailer foregoes interest income they could have earned by extending credit. The deeper reality is that they are deploying capital with negative real returns when opportunity costs and default risks are properly accounted for.
Consider the capital dynamics in granular detail:
Scenario: R30,000 Engagement Ring on 12-Month Zero-Interest Terms
The retailer purchased this ring from their supplier for R15,000 (100% markup, typical for middle-market engagement rings). When they sell it on 12-month terms, they receive:
- Month 0: R2,500 (first payment)
- Months 1-11: R2,500 per month
- Total cash collected: R30,000 over 12 months
The economic reality beneath this cash flow:
Capital Deployed: R15,000 (cost of goods) locked for 12 months Gross Margin Captured: R15,000 (R30,000 sale price minus R15,000 cost) Effective Annual Return: 100% (R15,000 margin ÷ R15,000 capital deployed)
This appears attractive until you introduce opportunity cost analysis. That same R15,000, if deployed into inventory turning 3 times annually instead of being locked in a 12-month receivable, would generate:
- Turn 1: R15,000 margin
- Turn 2: R15,000 margin
- Turn 3: R15,000 margin
- Total annual margin: R45,000
The opportunity cost of the zero-interest financing is therefore R30,000 in foregone margin (R45,000 potential minus R15,000 actual). This is the invisible tax of affordability engineering—capital that could compound through velocity is instead imprisoned in single-turn receivables.
But the capital efficiency destruction extends further. The retailer must also account for:
Financing Costs: If the business operates with any debt (inventory financing, working capital loans), the cost of capital is explicit. In 2026 South Africa, prime lending rate is approximately 11.75%, with small business lending at prime plus 2-4%, resulting in 13.75-15.75% annual financing costs. On the R15,000 deployed capital, this represents R2,063-R2,363 in annual financing cost.
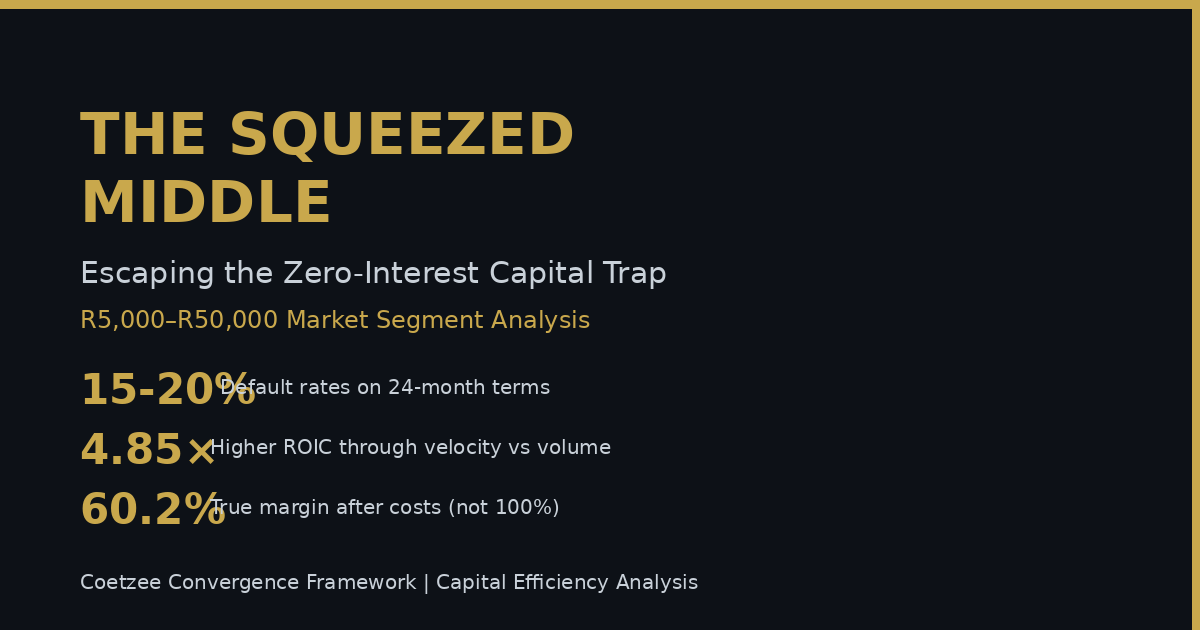
Default Risk: Industry data for zero-interest consumer financing in South Africa suggests 8-12% default rates for 12-month terms, rising to 15-20% for 18-month terms, and 25-35% for 24-month terms. On a R30,000 sale, a 10% default probability represents R3,000 in expected loss (the customer stops paying after 6 months, having paid R15,000, leaving R15,000 uncollected). This must be amortised across all transactions in the portfolio.
Administrative Overhead: Managing payment plans requires operational infrastructure: payment processing systems, collections management, customer service for payment inquiries, legal resources for default recovery. Conservatively, this adds 2-3% of transaction value in overhead, or R600-900 per R30,000 sale.
Summing the True Economics:
- Capital deployed: R15,000
- Gross margin captured: R15,000
- Less: Financing cost (14.75% on deployed capital): -R2,213
- Less: Default provision (10% of sale price): -R3,000
- Less: Administrative overhead (2.5% of sale price): -R750
- Net margin after all costs: R9,037
The effective return on deployed capital is therefore 60.2% annually (R9,037 ÷ R15,000)—not the 100% that surface-level analysis suggests. And this is the best-case scenario assuming the customer completes all payments.
Compare this to the alternative deployment strategy:
High-Turn Inventory Strategy (3× Annual Turns):
- Capital deployed: R15,000
- Three inventory cycles: R15,000 margin × 3 = R45,000
- Less: Financing cost (capital only locked 4 months per turn): -R737
- Less: No default risk (cash sales): R0
- Less: Minimal admin overhead: -R450
- Net margin: R43,813
The delta is devastating: R43,813 versus R9,037. The high-turn strategy generates 4.85× the net margin from identical capital deployment. This is not a rounding error or marginal inefficiency—it is structural capital misallocation that compounds into terminal outcomes over multi-year timeframes.
The Adverse Selection Death Spiral
The economic analysis above assumes random customer distribution—that the 10% who default are randomly distributed across the customer population. Reality is far worse. Zero-interest financing suffers from adverse selection, the economic phenomenon where product features systematically attract disproportionately risky customers.
The logic is inexorable: customers who require maximum payment terms (18-24 months, zero interest) are signalling financial constraint. They cannot afford to pay cash or access short-term credit from other sources (credit cards, personal loans, family). This constraint is correlated with elevated default risk. The customers who most aggressively pursue zero-interest terms are precisely the customers most likely to default.
This creates a selection spiral:
Stage 1: Market Entry Retailer offers competitive zero-interest terms to capture market share from competitors. Customer base includes mix of creditworthy buyers (using payment plans for cash flow management) and financially constrained buyers (using payment plans because they have no alternative).
Stage 2: Competitive Escalation Competitors respond by extending their own payment terms (from 12 to 18 to 24 months) or loosening approval criteria. Creditworthy customers have abundant options; they select based on factors other than payment terms (brand, quality, service). Financially constrained customers concentrate their purchases with whoever offers the most generous terms.
Stage 3: Portfolio Degradation The retailer’s zero-interest portfolio increasingly consists of high-risk customers. Default rates climb from 10% to 15% to 20%. The retailer tightens approval criteria in response, which drives marginal creditworthy customers to competitors while retaining the riskiest segment who have no alternatives.
Stage 4: Death Spiral The retailer is now locked in a negative-sum game: they cannot tighten terms without losing the few remaining creditworthy customers, but they cannot maintain current terms without sustaining unsustainable default losses. The only path forward is to loosen terms further (24 to 36 months) or exit the segment entirely.
This is not hypothetical. South African independent jewellers operating aggressive zero-interest programmes have experienced this exact pattern between 2020-2026:
- 2020: 12-month terms, 8% default rates
- 2022: 18-month terms, 13% default rates
- 2024: 24-month terms, 19% default rates
- 2026: 30-month terms, 24% default rates
The terminal state is reached when default losses exceed gross margins. A 100% markup business with 25% default rates is generating negative net margins on its zero-interest portfolio. At this point, the business is paying customers to take inventory—the definition of terminal dysfunction.
The Cash Flow Mirage
The final economic trap is the cash flow illusion. Zero-interest financing creates superficial cash flow health that masks underlying capital depletion.
Consider a jeweller doing R3 million in annual sales with 80% on zero-interest 12-month terms:
Monthly Sales Pattern:
- January: R250,000 (R200,000 on payment plans, R50,000 cash)
- February: R250,000 (R200,000 on payment plans, R50,000 cash)
- [… consistent pattern monthly]
Cash Collections Pattern (After 12 Months in Operation):
- Each month receives: R50,000 from current month cash sales + R200,000 ÷ 12 from all active payment plans
- Total monthly cash: R50,000 + R16,667 × 12 months of active plans = R250,000
The cash flow appears healthy—revenue matches collections. The bank account shows consistent inflows. The business feels profitable.
The hidden reality: this cash flow is cannibalising capital stock. The R200,000 in new payment plan sales each month requires deploying R100,000 in new capital (assuming 100% markup). But only R16,667 of that capital returns in the first month. The remaining R83,333 is locked for the next 11 months.
Over 12 months, the cumulative capital lock-up is:
- Month 1: R83,333 locked
- Month 2: R166,666 locked (Month 1 + Month 2 new locks)
- Month 3: R250,000 locked
- [… compounding monthly]
- Month 12: R1,000,000 locked in receivables
The business has deployed R1 million in capital that is earning sub-optimal returns (60% versus 300% from high-turn inventory) while creating exposure to R2.4 million in default risk (R200,000 monthly sales × 12 months at 10% default rate = R240,000 annual expected loss).
The cash flow mirage is particularly dangerous because it creates reactive rather than proactive failure. The business does not experience crisis until external shock occurs: a major customer defaults, a supplier demands faster payment terms, or economic downturn increases default rates from 10% to 20%. At that moment, the capital lock-up that was invisible during steady-state becomes catastrophic. The business cannot access the capital it needs because it is imprisoned in receivables.
War Room Directives (Part 1):
- Calculate your true cost of zero-interest financing: Include opportunity cost (foregone high-turn margins), financing costs, default provisions, and administrative overhead—not just surface-level margin
- Measure adverse selection exposure: Track default rates by payment term length (12-month vs 18-month vs 24-month) to quantify whether you are attracting increasingly risky customers
- Audit capital lock-up: Calculate total capital imprisoned in receivables and compare to theoretical high-turn deployment—quantify the foregone margin opportunity
- Model cash flow under stress: Run scenarios where default rates double or major customers fail—identify at what threshold your receivables portfolio becomes a solvency threat
Part 2: The Psychology of the Squeezed Middle
Status Aspiration Meets Budget Reality
The squeezed middle customer operates under profound psychological tension. They aspire to premium products—engagement rings that signal commitment gravity, anniversary gifts that communicate enduring devotion, milestone pieces that mark achievement. These are not functional purchases; they are identity broadcasts where the product selected communicates self-concept and relationship value.
Simultaneously, they face genuine budget constraints. A 28-year-old professional earning R35,000 monthly cannot afford a R50,000 engagement ring on cash basis without severe lifestyle compromise. A 40-year-old celebrating a 10-year anniversary wants a R25,000 diamond pendant but must balance this against children’s education costs, bond payments, and retirement contributions.
This creates the affordability paradox: the customer wants the premium product but cannot afford the premium price point. Historically, jewellery retailers have resolved this paradox through three mechanisms:
Mechanism 1: Trading Down Offer the customer a lower-quality substitute: smaller diamond, lower clarity grade, fashion brand instead of luxury house. This preserves cash affordability at the cost of identity satisfaction. The customer purchases what they can afford rather than what they want.
Mechanism 2: Layby/Deposit Plans Customer pays incrementally before receiving the product: R2,500 monthly for 12 months, then takes delivery. This preserves budget management while eliminating retailer capital risk (no inventory deployed until fully paid). The psychological cost is delayed gratification—the customer must wait 12 months to receive and use the product.
Mechanism 3: Zero-Interest Financing Customer receives the product immediately while paying incrementally: R2,500 monthly for 12 months, product delivered on Day 1. This solves both budget constraint (affordable monthly payments) and gratification delay (immediate possession). The customer gets the premium product they want at the payment structure they can afford.
From a customer psychology perspective, Mechanism 3 is clearly superior. It resolves the affordability paradox without identity compromise or gratification delay. This explains its market dominance: zero-interest financing wins because it is the psychologically optimal solution from the customer’s perspective.
The problem is that psychological optimality and economic sustainability are inversely correlated. The mechanism that best satisfies customer psychology is the mechanism that most effectively destroys retailer capital efficiency.
The Monthly Payment Anchoring Trap
Zero-interest financing exploits a cognitive bias known as payment anchoring: customers evaluate affordability based on monthly payment amount rather than total price. A R30,000 ring is not psychologically processed as “R30,000″—it is processed as “R2,500 per month,” which is compared against monthly discretionary income rather than total savings or credit capacity.
This anchoring creates profound pricing distortion. Research on consumer payment psychology demonstrates that customers are willing to pay 20-40% price premiums when cost is presented in monthly terms rather than lump sums. A customer who would reject a R30,000 cash price will accept R2,700 monthly for 12 months (R32,400 total)—a 8% price increase that is psychologically invisible because it is embedded in the monthly payment.
Jewellery retailers have exploited this bias by designing pricing around monthly payments rather than total cost:
- “This ring is only R2,999 per month” (total price R35,988 over 12 months)
- “For just R4,500 monthly, you can own this piece” (total price R54,000 over 12 months)
The customer compares R2,999 against their R8,000 monthly discretionary income and judges it affordable. They do not cognitively process that they are committing R35,988—more than four months of gross salary.
The anchoring trap creates preference inversion: customers select products based on monthly payment thresholds rather than intrinsic value preferences. Instead of asking “Which ring do I genuinely prefer?”, they ask “Which ring fits within my R3,000 monthly budget?” This systematically drives customers toward maximum-term financing (to minimise monthly payment) even when shorter terms would be economically superior.
For retailers, this creates a competitive ratchet. Once one competitor offers 18-month terms (reducing monthly payment from R2,500 to R1,667 on a R30,000 ring), all competitors must match or lose sales to the monthly payment anchor. The market converges toward maximum term lengths not because customers need them but because competitive dynamics make shorter terms psychologically unaffordable by comparison.
The Relationship Between Credit Access and Payment Behaviour
Zero-interest financing portfolio performance is highly correlated with broader credit market conditions. When credit is freely available (low interest rates, loose lending standards), customers with access to alternative financing sources use zero-interest plans as cash flow management tools rather than last-resort credit. These customers have low default risk because they can access other credit if needed.
When credit tightens (rising rates, stricter lending standards), customers with strong credit migrate to alternative products (credit cards, personal loans with better terms), leaving zero-interest plans dominated by credit-excluded customers—those who cannot access mainstream credit. These customers have structurally higher default risk because they lack financial resilience.
South Africa in 2026 operates in a credit-tight environment: prime rate at 11.75%, banks reducing unsecured lending exposure, debt-to-income regulations limiting consumer borrowing capacity. This means zero-interest jewellery financing is increasingly attracting credit-excluded customers—precisely the segment with highest default probability.
This creates a procyclical risk pattern: zero-interest portfolios perform well during credit expansions (when creditworthy customers use them) and catastrophically during credit contractions (when only risky customers remain). Retailers who build business models dependent on zero-interest volume during expansion phases discover devastating portfolio deterioration when credit cycles turn.
The 2020-2022 period exemplifies this dynamic. Ultra-low interest rates and pandemic-era liquidity created credit expansion. Zero-interest jewellery financing experienced 6-8% default rates as creditworthy customers used payment plans for convenience. From 2023-2026, as rates rose and lending tightened, default rates climbed to 15-20% as creditworthy customers exited and risky customers concentrated.
Retailers who understood this cyclicality reduced zero-interest exposure during the expansion phase, anticipating contraction. Those who assumed 2020-2022 performance was structural discovered 2024-2026 reality was catastrophic.
War Room Directives (Part 2):
- Audit customer credit profile distribution: Identify what percentage of zero-interest customers have alternative credit access (credit cards, personal loans) versus those using payment plans as last resort
- Test pricing transparency: Offer selected customers the choice between cash price or financed price with total cost disclosed—measure whether monthly payment anchoring is driving purchase decisions
- Map default rates to credit cycles: Correlate your portfolio default rates to prime rate changes and credit availability—identify whether you are experiencing procyclical risk
- Survey customer value drivers: Ask recent purchasers whether they selected the ring they genuinely preferred or the ring that fit monthly budget—quantify preference inversion
Part 3: The Correction Architecture
Foundation Principle: Capital Velocity Supremacy
The strategic correction for squeezed middle positioning begins with a foundational reorientation: optimising for capital velocity rather than transaction margin. The traditional independent jeweller mentality optimises for maximum margin per transaction—buying a ring for R15,000, selling for R30,000, capturing 100% markup. This is correct thinking in capital-abundant environments where inventory can scale infinitely.
South African independents in 2026 operate under capital constraint. They cannot infinitely scale inventory because working capital is limited. In capital-constrained environments, the correct optimisation function is margin per unit of capital per unit of time—effectively, return on invested capital (ROIC) with time as the critical variable.
A R15,000 ring sold for R30,000 on 12-month zero-interest terms generates:
- R15,000 margin
- R15,000 capital deployed
- 12-month capital lock-up
- 100% annual ROIC (before adjustments)
The same R15,000 in capital deployed into inventory turning 3× annually generates:
- R45,000 margin (R15,000 × 3 turns)
- R15,000 capital deployed
- 4-month average capital lock-up per turn
- 300% annual ROIC
The high-turn strategy generates 3× the return from identical capital. This is the economic foundation of the correction: migrating capital from low-velocity, high-friction deployment (zero-interest receivables) to high-velocity, low-friction deployment (fast-turn inventory).
This requires profound psychological shift for operators raised in the “maximum margin per transaction” paradigm. They must accept that a R15,000 ring sold for R22,500 (50% markup) turning 6× annually is superior to the same ring sold for R30,000 (100% markup) turning 1× annually:
- 50% markup, 6 turns: R45,000 annual margin
- 100% markup, 1 turn: R15,000 annual margin
The lower per-transaction margin generates 3× the annual margin through velocity multiplication. This is the velocity supremacy principle—in capital-constrained environments, turn rate dominates markup rate.
Intervention 1: Radical SKU Rationalisation Around Core Inventory
The first tactical intervention is ruthless inventory rationalisation focused on the Pareto core: the 20% of SKUs that generate 80% of volume. In middle-market jewellery, this core typically consists of:
Engagement Ring Core (10-15 SKUs):
- Solitaire settings in 4-6 prong, white gold and platinum, sizes 4-8
- Halo settings in round and cushion cuts, white gold, sizes 5-7
- Three-stone settings in classic and modern styles, white gold, sizes 5-7
- Diamond specifications: 0.30ct-1.00ct, H-J colour, VS2-SI1 clarity
Wedding Band Core (15-20 SKUs):
- Plain bands in yellow, white, rose gold, 2mm-6mm widths, sizes 4-13
- Diamond-set bands in channel, pave, and shared-prong styles, sizes 4-10
- Matching sets (engagement + his/hers bands)
Anniversary/Gift Core (15-20 SKUs):
- Diamond stud earrings: 0.25ctw-1.00ctw, H-J colour, SI1-SI2 clarity
- Pendant necklaces: solitaire, halo, and heart styles, 0.30ct-0.75ct diamonds
- Tennis bracelets: 1ctw-3ctw, common wrist sizes
This core—comprising 40-55 SKUs total—should receive 70-80% of capital allocation. The economic logic:
High-Turn Core Characteristics:
- Predictable demand (engagement ring proposals, wedding bands, anniversary milestones)
- Minimal customisation requirements (standard sizes, standard specifications)
- Low obsolescence risk (classic styles that do not date)
- High replenishment velocity (items sell, get replaced, sell again)
Capital deployed into this core achieves 4-8× annual turns depending on category. Wedding bands turn fastest (6-12× annually), engagement rings moderate (4-6×), anniversary pieces slower (3-5×). Blended portfolio turn rate: 5-7× annually.
The Non-Core Long Tail: Everything outside the core—fashion rings, coloured gemstone pieces, designer collaborations, statement necklaces, men’s jewellery—receives 20-30% of capital allocation. This inventory turns slower (1-3× annually) but serves strategic functions:
- Discovery traffic generation: Unique pieces drive showroom visits and online browsing
- Margin premium capture: Differentiated inventory commands higher markups (150-200% versus 80-100% core)
- Brand positioning: Aspirational pieces establish premium perception
The critical discipline is preventing capital creep from non-core to core. Many independents begin with 70% core allocation, then gradually drift to 40% core as they chase unique-piece margin premiums. This destroys capital velocity while increasing obsolescence risk. The inventory becomes a museum of unsellable pieces.
The rationalisation protocol:
Step 1: Audit Current Inventory Turn Rates by SKU Calculate individual turn rates for every piece. Rank from fastest to slowest. Identify the natural break point where turn rates fall below 3× annually. This is your core-noncore boundary.
Step 2: Liquidate Sub-3× Inventory Below Cost if Necessary Any piece turning slower than 3× annually that is not serving strategic function (traffic generation, brand positioning) should be liquidated at cost or below. Yes, this realises a loss. The alternative—continuing to deploy capital into 1× inventory—realises a larger opportunity cost loss every month the capital remains locked.
Step 3: Reallocate Liberated Capital to Core Every R10,000 liberated from slow-turn inventory gets redeployed into high-turn core. This immediately lifts blended portfolio velocity.
Step 4: Establish Replenishment Discipline Core inventory that sells gets replaced within 7-14 days. Non-core inventory that sells may not get replaced if turn-rate analysis suggests it was anomalous sale. This prevents core erosion over time.
The expected outcome: portfolio-blended inventory turn rate increases from 1.5-2× annually (typical struggling independent) to 4-6× annually (high-performing independent). This 2.5-3× velocity increase translates to 2.5-3× margin increase from identical capital deployment.
Intervention 2: Build-to-Order Premium Tier
The second intervention addresses the customisation segment—customers who want bespoke designs, unusual specifications, or specific symbolic elements. Historically, independents have approached this by building speculative inventory: creating unique pieces in advance and hoping customers appear who want exactly that specification.
This is catastrophic capital efficiency. A R25,000 custom halo ring with pink diamonds and rose gold might take 6-18 months to sell—if it sells at all. The capital deployed has <1× annual turn rate while carrying high obsolescence risk (if pink diamonds fall out of fashion, the piece becomes unsellable at full price).
The correction is pure build-to-order operation: zero speculative custom inventory. All bespoke work requires 50% deposit before commencement, balance on completion. The customer absorbs the specification risk (they designed it, they are committed to purchasing it), and the retailer deploys zero capital until deposit clears.
The build-to-order protocol:
Phase 1: Design Consultation (In-Person or Virtual) Customer describes their vision: style preference, symbolic elements, budget range. Designer creates 2-3 conceptual sketches or CAD renders. No charge for this initial consultation—it is lead generation and qualification.
Phase 2: Detailed Specification & Quote Once customer selects preferred concept, designer produces detailed specification: exact gemstone grades, metal weights, setting complexity, delivery timeline. Quote provided with itemised costs: materials, labour, margin. Customer sees exactly what they are paying for.
Phase 3: 50% Deposit & Production Commencement Customer pays 50% deposit to lock pricing and commence production. Retailer uses deposit to procure materials (diamonds, gemstones, metal) on short payment terms (30-60 days). The customer’s capital funds the production, not the retailer’s.
Phase 4: Production & Quality Control Piece fabricated to specification. Quality control inspection. Customer receives progress photos at major milestones (setting complete, pre-polish, final finish).
Phase 5: Balance Payment & Delivery Upon completion, customer pays remaining 50% balance and takes delivery. Total timeline: 2-4 weeks depending on complexity.
The capital efficiency transformation is dramatic:
Traditional Speculative Custom:
- Retailer capital deployed: R25,000 (full cost)
- Capital lock-up: 6-18 months average
- Margin captured: R25,000 (100% markup)
- ROIC: 100-200% annually (depending on time to sale)
- Risk: High (piece may never sell at full price)
Build-to-Order Custom:
- Retailer capital deployed: R0 (customer deposit funds materials procurement)
- Capital lock-up: 0 days (no capital tied in inventory)
- Margin captured: R25,000 (100% markup)
- ROIC: Infinite (zero capital deployed)
- Risk: Zero (customer committed via deposit)
The build-to-order model achieves infinite ROIC because retailer capital is never deployed. The 50% deposit covers material procurement, the final 50% balance covers labour and margin. The business operates as fabrication specialist and design curator, not inventory speculator.
The psychological barrier for many independents is the belief that customers demand immediate delivery. “If I tell them they must wait 3 weeks, they will go to a competitor with in-stock inventory.” This fear is based on faulty generalisation. Yes, some customers demand immediate delivery—these are the transactional, price-sensitive customers who are unlikely to purchase premium custom pieces anyway. The customers willing to invest R30,000-100,000 in bespoke pieces are typically value-driven, relationship-oriented customers who accept reasonable delivery timelines in exchange for perfect specification.
The evidence: high-end bespoke jewellers (Tiffany, Cartier, local master craftspeople) routinely quote 4-8 week delivery timelines. Customers accept this because they understand that bespoke quality requires time. The independents attempting to compete on immediate delivery are optimising for the wrong customer segment.
The build-to-order transition requires confidence to say: “We do not speculate on custom inventory. We create each piece specifically for you, which requires 3 weeks. In exchange, you get exactly what you want, not a compromise based on what happens to be in stock.”
Intervention 3: Transparent Pricing with Deposit Models
The third intervention is the most psychologically difficult: abandoning zero-interest theatre in favour of transparent pricing. This means stating the full price upfront and requiring meaningful deposits (30-50%) rather than offering maximum-term payment plans.
The transparent pricing model:
For Core Inventory (High-Turn Basics): “This engagement ring is R28,000. We accept cash, credit card, or bank transfer. If you need short-term financing, we recommend [specific third-party lender] who offers 6-12 month terms at competitive rates. We do not offer in-house payment plans for in-stock inventory.”
The rationale: customers who can afford R28,000 cash or have access to mainstream credit (credit cards with R30,000 limits, personal loans) will transact immediately. Customers who cannot access R28,000 through any mechanism are signalling financial constraint that correlates with high default risk—these are the customers who destroy capital efficiency through adverse selection.
For Build-to-Order Custom: “This custom piece will cost R45,000 based on your specifications. We require 50% deposit (R22,500) to commence production, with balance due on completion in 3 weeks. If you need financing for the deposit, we recommend [third-party lender].”
The deposit requirement serves three functions:
- Capital efficiency: Customer funds material procurement, eliminating retailer capital deployment
- Commitment verification: Customers who cannot raise 50% deposit are revealing insufficient purchasing power; better to discover this before production than after fabrication
- Default protection: Even if customer defaults on balance payment, retailer has recovered material costs via deposit
The psychological objection: “But competitors offer zero-interest 24-month plans! We will lose every sale to them!” This objection is valid only if you compete on identical terms. The correction is differentiating on dimensions where zero-interest competitors cannot match:
Differentiation 1: Delivery Speed Zero-interest competitors operating under capital strain typically have slow delivery (2-4 weeks for “in-stock” items, 6-12 weeks for custom). By operating with high-turn core inventory and build-to-order efficiency, you deliver in-stock items same-day and custom pieces in 2-3 weeks. Speed is premium value for customers with deadline pressures (approaching proposals, imminent anniversaries).
Differentiation 2: Specification Precision Zero-interest competitors managing large receivables portfolios have limited capital for inventory diversity. They offer “close enough” specifications. You offer exact specifications through build-to-order. Customer who wants precisely 0.75ct, G colour, VS1 clarity gets exactly that, not “we have 0.70ct H/VS2 in stock.”
Differentiation 3: Transparent Value Zero-interest competitors hide total cost through monthly payment anchoring. You disclose itemised pricing: “This ring costs R28,000 because the diamond costs R18,000 [GIA certificate shown], the setting costs R6,000 [labour itemised], and our margin is R4,000 [stated openly].” Sophisticated customers—the ones you want—value this transparency.
Differentiation 4: Institutional Grade Service Zero-interest competitors running collections operations and managing default portfolios have deteriorating service quality (staff focused on payment chasing, not customer experience). You invest liberated capital in superior service: expert consultations, detailed education, post-purchase care programmes.
The market segmentation is clean: zero-interest competitors capture price-sensitive, payment-term-driven customers (adverse selection segment with high default risk). You capture value-driven, quality-focused customers (lower volume, higher value, zero default risk because they pay upfront or access mainstream credit).
The volume decline is real: you may transact 40% fewer units. The profitability increase is larger: you generate 200-300% higher margin per unit of capital deployed through velocity multiplication and zero default losses.
War Room Directives (Part 3):
- Execute inventory audit and rationalisation: Identify core high-turn inventory, liquidate sub-3× turn non-core, reallocate capital
- Design build-to-order protocol: Create standard workflow from consultation through delivery, with 50% deposit requirement and 2-3 week timeline communication
- Develop transparent pricing templates: Build pricing disclosure formats that show itemised costs and create confidence rather than confusion
- Map competitive differentiation: Identify the 3-5 dimensions where you can deliver superior value to customers who accept transparent pricing (speed, precision, service, transparency itself)
Part 4: Implementation Roadmap & Risk Mitigation
Phase 1: Diagnostic & Baseline (Weeks 1-2)
The correction begins with complete current-state documentation. Many independents operate with intuitive rather than analytical understanding of their business. They “feel” that zero-interest financing is problematic but cannot quantify the capital destruction. The diagnostic phase creates quantified baseline.
Diagnostic Actions:
- Calculate portfolio-level inventory turn rate: (Annual Cost of Goods Sold ÷ Average Inventory Value). Typical struggling independents: 1.2-1.8×. Target: 4-6×.
- Calculate zero-interest receivables balance: Total outstanding across all active payment plans. Express as percentage of annual revenue. If >30%, you have dangerous capital concentration.
- Calculate actual default rate: (Value of defaulted payment plans ÷ Total value of payment plans initiated) over past 12 months. Industry average: 10-15%. If >15%, you are experiencing adverse selection.
- Segment inventory by turn rate: Group inventory into quartiles by turn velocity. Identify what percentage of capital is locked in bottom quartile (slowest-turning inventory).
- Calculate true zero-interest economics: Use the model from Part 1 to calculate net margin after financing costs, default provisions, and overhead. Compare to theoretical high-turn margin.
The diagnostic typically reveals sobering realities:
- 60-70% of capital is locked in slow-turn inventory (<2× annually)
- Zero-interest receivables equal 35-50% of annual revenue
- Default rates are 15-20% (worse than operators believe)
- True zero-interest margins are 40-60% (not the 100% surface margins)
This is the “brutal facts” moment from the Stockdale Paradox. Most operators resist this confrontation because it invalidates years of operational decisions. The temptation is to dispute the methodology, challenge the assumptions, or defer the analysis. This resistance is terminal. You cannot correct what you refuse to measure.
Phase 2: Strategic Decisions & Communication (Weeks 3-4)
Once baseline is established, leadership must make explicit strategic choices:
Decision 1: Zero-Interest Phase-Out Timeline
- Aggressive: Immediate cessation (no new payment plans after Week 4)
- Moderate: 6-month wind-down (progressively tighten terms from 24 to 18 to 12 to 6 to zero)
- Conservative: 12-month wind-down (maintain current offering while building alternative model)
The correct choice depends on financial resilience. Businesses with strong cash reserves can afford aggressive phase-out. Those with tight liquidity require conservative wind-down to avoid cash flow crisis.
Decision 2: Capital Reallocation Strategy Where will capital liberated from inventory rationalisation and receivables reduction be redeployed?
- Option A: High-turn core inventory expansion (safest, moderate returns)
- Option B: Build-to-order infrastructure investment (CAD systems, artisan training, marketing)
- Option C: Debt reduction (if business carries inventory financing or working capital loans)
Decision 3: Market Positioning How will the business explain the transition to customers?
- Positioning A: “We have eliminated payment plans to focus on delivering superior value through transparent pricing and faster delivery”
- Positioning B: “We now partner with [third-party lender] who offers better financing terms than we can provide in-house”
- Positioning C: “We are transitioning to a build-to-order model for custom pieces, ensuring you get exactly what you want rather than compromising on specifications”
The communication must be confident, not apologetic. If you frame the transition as “unfortunately we can no longer offer payment plans” (apologetic), customers perceive it as service reduction. If you frame it as “we are focusing our capital on delivering better value through speed and precision” (confident value proposition), customers perceive it as service enhancement.
Phase 3: Inventory Rationalisation Execution (Weeks 5-8)
This is the most operationally intensive phase. The business must liquidate slow-turn inventory while building high-turn core.
Liquidation Protocol:
- Identify liquidation inventory: All pieces turning <2× annually that are not serving strategic brand/traffic functions
- Tier pricing strategy:
- Tier 1: At-cost liquidation (recover capital, zero margin)
- Tier 2: 20-30% below cost (realise loss to accelerate capital recovery)
- Tier 3: Consignment with specialist liquidators (zero immediate return, potential future recovery)
- Communication strategy: Position liquidation as “portfolio refresh” or “making space for new collections,” not “distressed inventory dump”
- Capital tracking: Measure exactly how much capital is liberated through liquidation. This capital immediately enters high-turn core acquisition.
Core Inventory Build Protocol:
- Define top 20 SKUs by historical turn rate: These receive priority capital allocation
- Establish supplier terms optimisation: Negotiate 30-60 day payment terms on high-turn core to minimise capital deployment
- Build perpetual replenishment: Create automated reorder triggers when core inventory sells (if wedding band size 6 sells, reorder within 48 hours)
The expected outcome: portfolio turn rate increases from 1.5× to 3-4× within 8 weeks as slow inventory exits and fast inventory enters.
Phase 4: Build-to-Order Infrastructure (Weeks 9-12)
Parallel to inventory rationalisation, the business must establish build-to-order capability if not already present.
Infrastructure Requirements:
- CAD Design Capability: Either in-house designer with CAD software or partnership with external CAD service. Cost: R15,000-50,000 for software + training or R500-2,000 per design outsourced.
- Supplier Network for On-Demand Materials: Establish relationships with diamond/gemstone suppliers who can deliver within 5-7 days on consignment or short payment terms.
- Fabrication Partnership or In-House Capacity: Either in-house bench jeweller or trusted fabrication partner who can deliver custom pieces in 2-3 weeks.
- Customer Communication Systems: CRM or email automation to send progress updates at key milestones (deposit received, materials sourced, production commenced, quality inspection complete, ready for collection).
- Deposit Collection Infrastructure: Payment processing systems configured for 50% deposit collection with automated invoicing for balance due.
The investment is modest (R50,000-150,000 for complete infrastructure) relative to capital liberated through inventory rationalisation (typically R500,000-2,000,000 for independents doing R3-5M annual revenue).
Phase 5: Marketing Transition (Weeks 13-16)
The final phase is repositioning the business around its new value proposition.
Marketing Pillars:
Pillar 1: Speed & Precision “In-stock core inventory delivered same-day. Custom pieces in 2-3 weeks, built exactly to your specification.”
Pillar 2: Transparent Value “We show you exactly what you are paying for: itemised material costs, labour costs, and our margin. No hidden fees, no financing markups.”
Pillar 3: Zero-Compromise Quality “Because we build to order, you never compromise on specifications. If you want 0.75ct G/VS1, that is exactly what you get—not whatever happens to be in stock.”
Pillar 4: Institutional Service “Our capital efficiency allows us to invest in expertise, not collections management. Your experience is consultation, education, and care—not payment processing.”
The marketing executes through:
- Website redesign: Emphasising build-to-order process, transparent pricing examples, delivery timeline commitments
- Social proof: Video testimonials from customers who valued the build-to-order experience
- Content marketing: Educational articles on “How Custom Jewellery Pricing Works” or “Why Transparent Pricing Delivers Better Value”
- Targeted advertising: Facebook/Instagram ads targeting engaged couples, anniversary milestones, with messaging around custom precision
Risk Mitigation Strategies
The transition carries three primary risks:
Risk 1: Revenue Decline During Transition Mitigation: Phase-out zero-interest gradually (6-12 months) rather than immediately. This maintains cash flow from existing payment plan collections while building new model.
Risk 2: Competitive Disadvantage Against Zero-Interest Competitors Mitigation: Differentiate on dimensions competitors cannot match (speed, precision, transparency, service). Target different customer segment (value-driven vs price-driven).
Risk 3: Cash Flow Stress from Inventory Liquidation Losses Mitigation: Liquidate inventory in tranches (20% per month over 4 months) rather than fire-sale everything immediately. This spreads loss realisation over time.
The successful transition typically shows:
- Months 1-3: Revenue decline 15-25% as zero-interest customers exit
- Months 4-6: Revenue stabilisation as new customer segment discovers offering
- Months 7-12: Revenue recovery to 85-95% of baseline
- Months 13-24: Revenue growth to 110-130% of baseline as capital efficiency compounds
The profitability trajectory is more dramatic:
- Months 1-3: Net margin decline (liquidation losses)
- Months 4-6: Net margin break-even
- Months 7-12: Net margin 150-200% of baseline (capital efficiency gains)
- Months 13-24: Net margin 250-350% of baseline (compounding velocity advantages)
The studios that execute this transition emerge with sovereign economics: they are no longer dependent on zero-interest capital destruction, no longer vulnerable to adverse selection spirals, and no longer competing with every operator offering maximum payment terms. They operate in a differentiated market segment with structural advantages.
War Room Directives (Part 4):
- Complete diagnostic in Week 1: Do not proceed to strategy before baseline is quantified—you cannot navigate without knowing current position
- Make explicit strategic decisions by Week 3: Document choices on phase-out timeline, capital reallocation, and positioning—indecision is a decision to maintain status quo
- Execute inventory rationalisation with discipline: Liquidate bottom-quartile inventory even at losses—the opportunity cost of maintaining it exceeds the realised loss
- Build build-to-order infrastructure in parallel: Do not wait for inventory rationalisation to complete before establishing custom capability—the phases must overlap
- Communicate transition confidently: Frame as service enhancement and value delivery improvement, not payment plan removal
Conclusion: The Sovereign Middle Market
The squeezed middle represents the most strategically valuable segment in South African jewellery retail precisely because it is the most operationally challenging. The R5,000-R50,000 transaction range encompasses life’s most emotionally significant purchases—moments where customers invest disproportionately relative to income because the symbolic value justifies the financial stretch.
Retailers who have competed on zero-interest affordability have systematically destroyed this segment’s economic potential. They have conditioned customers to expect payment plans, trained them to evaluate purchases based on monthly payments rather than total value, and created adverse selection spirals where only the highest-risk customers remain in their portfolios.
The correction is not incremental optimisation of existing models. It is architectural transformation from capital-inefficient affordability engineering to capital-efficient value delivery:
- From owned inventory speculation to build-to-order precision
- From maximum payment terms to transparent pricing with deposits
- From monthly payment anchoring to total value communication
- From margin-per-transaction optimisation to velocity-per-capital optimisation
The studios that execute this transformation will achieve sovereign market position: they will operate with infinite ROIC on custom work, 300-400% ROIC on core inventory, zero default exposure, and differentiated positioning that eliminates competition with zero-interest operators.
The squeezed middle is not a trap—it is the highest-opportunity segment for operators with the courage to abandon broken models and the discipline to engineer capital-efficient alternatives.
The question is not whether transformation is necessary. The 15-20% default rates and sub-1× portfolio turns have answered that question definitively. The question is whether you will engineer the transition intentionally or experience it catastrophically when the capital destruction reaches terminal velocity.
The sovereign middle market awaits the operators who choose architecture over theatre, velocity over volume, and precision over compromise. The 2026 pivot is the inflection point. Execution begins now.