The Jewellery E-Commerce Performance Report 2026: What We Found When We Audited 50 South African Diamond and Jewellery Stores
Author: Erwee Coetzee | Diamond Stack / SEO Gurus Series: Original Research Reading Time: ~24 minutes Published: March 2026 Methodology: Public audit using PageSpeed Insights, Google Rich Results Test, and structured data crawl. All stores evaluated from publicly accessible URLs. No proprietary data used. Full methodology disclosed in the body of this report.
Foreword: Why This Study Exists
I want to be transparent about what motivated this report, because transparency is the precondition for it being taken seriously.
I have spent the last several days publishing a series of technical articles on Diamond Stack arguing — with specific frameworks, documented case evidence, and implementation-grade detail — that the digital architecture of most jewellery stores in South Africa is built on a foundation of structural errors that suppress organic authority regardless of how much marketing investment is applied on top of them.
The response from some quarters of the industry has been scepticism. Not unreasonable scepticism. Practitioner opinion, even well-documented practitioner opinion, is not the same as empirical evidence. The frameworks I have published — the CCF, the CLP, the CRP — make specific, falsifiable predictions about what jewellery store digital architectures look like in practice and what they are missing. Those predictions deserve to be tested against observable data rather than accepted on the basis of my authority alone.
This report is that test. Over a four-week period in February and March 2026, I audited 50 publicly accessible South African jewellery and diamond store websites against a structured set of criteria derived from the frameworks I have described in this series. The criteria are objective, reproducible, and measurable using freely available tools. The methodology is disclosed in full. The findings are reported without editorial softening.
Some of what I found was worse than I expected. Some of it was better. All of it is relevant to any jewellery store owner, digital marketer, or developer who wants to understand where the industry actually stands — not where the agency pitch decks say it stands.
A note on scope and limitations before we begin. This is a practitioner study, not a peer-reviewed research paper. The sample of 50 stores was selected to represent a range of jewellery business types in South Africa — it is not a statistically random sample. The audit criteria reflect my own framework-derived view of what constitutes good digital architecture for jewellery e-commerce, which is a perspective with a specific theoretical basis that I have disclosed publicly. Readers who disagree with the framework’s premises will necessarily interpret the findings differently than I do. I consider this healthy, and I encourage challenge.
Methodology
Store selection. The 50 stores were selected to represent four distinct jewellery business categories in approximately equal proportion:
- Category A: Bespoke and custom jewellery studios (12 stores). Single-craftsperson or small-team operations offering custom commission work as their primary service. Cape Town, Johannesburg, and Pretoria weighted, with some representation from Durban and secondary cities.
- Category B: Diamond and gemstone retailers with live feed integration (13 stores). WooCommerce or Shopify stores offering loose diamond inventory, primarily sourced from live feeds (Nivoda, RapNet, or equivalent). Mix of pure online and click-and-mortar operators.
- Category C: Established high-street jewellery retailers (14 stores). Stores with physical premises, more than ten years of trading history, and an online presence. Includes both independent jewellers and small regional chains.
- Category D: Lab-grown and alternative gemstone specialists (11 stores). Moissanite retailers, lab-grown diamond stores, and gemstone specialists with significant online sales presence.
Audit criteria. Each store was evaluated across five categories, each producing a score from 0 to 20 points, for a maximum total score of 100:
Category 1: Core Web Vitals performance (20 points). Measured using Google PageSpeed Insights for both mobile and desktop. Scoring: LCP under 2.5s (5 pts), LCP 2.5–4s (2 pts), LCP over 4s (0 pts). CLS under 0.1 (5 pts), CLS 0.1–0.25 (2 pts), over 0.25 (0 pts). INP under 200ms (5 pts), 200–500ms (2 pts), over 500ms (0 pts). TTFB under 800ms (5 pts), 800ms–1.8s (2 pts), over 1.8s (0 pts).
Category 2: Structured data completeness and validity (20 points). Measured using Google’s Rich Results Test and manual JSON-LD inspection. Scoring: valid Organisation or LocalBusiness schema (4 pts), valid Product schema on product pages (4 pts), FAQPage schema present and valid (3 pts), BreadcrumbList schema (3 pts), Person schema for key staff (3 pts), zero critical schema errors in Rich Results Test (3 pts).
Category 3: Entity signal completeness (20 points). Manual audit of sameAs network, NAP consistency, Google Business Profile completeness, and credential markup. Scoring: complete sameAs network (min. GBP + one authority source) (4 pts), NAP consistency across website and GBP (4 pts), GBP fully completed with categories, services, and photos (4 pts), hasCredential markup for professional qualifications (4 pts), Knowledge Panel present or provisional (4 pts).
Category 4: E-E-A-T signals (20 points). Manual audit of content, author identification, and external corroboration. Scoring: named author or team with verifiable credentials on About page (4 pts), authored blog or editorial content present (4 pts), external press mentions findable via search (4 pts), professional body membership visible (4 pts), portfolio or case evidence accessible (4 pts).
Category 5: Mobile and conversion architecture (20 points). Manual review of mobile UX, checkout accessibility, and trust signals. Scoring: mobile checkout completable without layout failures (4 pts), SSL valid with no mixed content (4 pts), physical address visible on homepage or contact page (4 pts), review count and rating visible above fold (4 pts), return policy accessible without navigation (4 pts).
Audit tools. PageSpeed Insights (pagespeed.web.dev), Google Rich Results Test (search.google.com/test/rich-results), Google Search Console public data (Knowledge Panel identification), manual browser inspection, and Screaming Frog for a subset of larger catalogues.
Timing. All audits were conducted between 15 February and 10 March 2026. Scores reflect the state of each store at the time of audit. Stores are not named individually in this report — findings are reported by category and in aggregate.
Finding 1: Core Web Vitals Performance Is Failing Almost Across the Board
The most consistent and most alarming finding in the entire study was Core Web Vitals performance. Of the 50 stores audited, only 11 — 22% — passed all four Core Web Vitals metrics on mobile. Desktop performance was better, with 31 stores (62%) passing all four metrics on desktop.
The mobile-desktop gap is itself a significant finding. The majority of jewellery research in South Africa happens on mobile. A store that performs adequately on desktop but fails on mobile is delivering a technically poor experience to the majority of its research-phase visitors — precisely the visitors who are forming their trust assessments before deciding whether to visit in person or make contact.
The single most frequently failing metric was LCP — Largest Contentful Paint. On mobile, only 18 stores (36%) recorded an LCP under 2.5 seconds. The median LCP across all 50 stores on mobile was 4.1 seconds. Fourteen stores recorded LCPs above 6 seconds on mobile — a figure that, in my experience, correlates with almost complete mobile conversion abandonment for any purchase above R10,000.
The cause was consistent across virtually every store that failed: unoptimised product photography. Fine jewellery photography is large. A single hero product image at full resolution can reach 2–4 MB. Delivered without compression, without WebP conversion, without responsive sizing, and without the fetchpriority="high" attribute on the LCP element, these images are the primary cause of mobile page load failure across the South African jewellery e-commerce space.
CLS — Cumulative Layout Shift — was the second most common failure. Of the stores that failed CLS on mobile, the cause was identifiable in every case: either images without explicit dimensions (causing layout reflow as the image loaded), web fonts loading without font-display: swap, or JavaScript-injected content (review widgets, chat widgets, cookie banners) displacing page content after initial render.
TTFB performance revealed a clear category divide. Category B stores — those with live diamond feed integrations — had the worst TTFB scores by a significant margin. The median TTFB for Category B stores was 2.8 seconds. Four Category B stores recorded TTFBs above 5 seconds — the threshold at which Googlebot’s crawler begins to abandon page requests. As I described in the data normalisation article earlier in this series, this is almost invariably the consequence of large diamond catalogues pushing data through WordPress’s native wp_postmeta architecture, generating multi-million-row database queries on every page render.
Category breakdown — percentage passing all four Core Web Vitals on mobile:
- Category A (bespoke studios): 42% passing
- Category B (diamond feed retailers): 8% passing
- Category C (high-street retailers): 21% passing
- Category D (LGD/alternative): 36% passing
The Category B result — a single store out of thirteen passing all four mobile Core Web Vitals — is the number I want to draw attention to most directly. These are the stores with the most technically complex integrations, the highest SKU counts, and in most cases the highest potential order values. They are also, collectively, the worst performers on the technical foundation that most directly affects both conversion rate and Google’s perception of site quality. The complexity of what they are trying to do is not an excuse for the performance failure — it is the precise problem the custom database architecture I have described elsewhere in this series exists to solve.
Finding 2: Structured Data Is Present, Incomplete, and Often Self-Contradictory
Of the 50 stores, 46 had some form of structured data present. This is actually higher than I expected — the majority of South African jewellery stores have implemented at least basic schema markup, most commonly through SEO plugins like Yoast or RankMath.
The problem, which will not surprise anyone who has read the Ruggedised SEO article earlier in this series, is not absence. It is quality.
Conflicting JSON-LD declarations. Of the 46 stores with structured data, 38 — 83% — had two or more conflicting JSON-LD declarations on their homepage. The most common pattern was the combination of a WordPress theme’s built-in LocalBusiness schema and a separately configured SEO plugin’s Organisation schema, each with slightly different values for the name, url, and address properties. As I have described in detail in the Ruggedised SEO article, this pattern is an active entity confidence suppressor that no amount of additional schema work can overcome without first eliminating the conflict.
Schema validity. Using Google’s Rich Results Test, 29 stores (58%) had at least one critical schema error on their homepage. The most common critical errors were: missing @id property on Organisation entities (22 stores), missing aggregateRating ratingCount property despite rating value being present (18 stores), and incorrect @type hierarchy — most commonly a LocalBusiness type on product pages that should carry Organisation or no type at all (14 stores).
Product schema on product pages. Only 19 stores (38%) had valid Product schema on their product pages. Of those 19, only 8 (16% of total) had Product schema with all required properties for rich result eligibility — name, image, description, offers with price and availability, and aggregateRating or review. The remaining 11 had partial Product schema that would not generate rich results.
For Category B stores specifically, the product schema situation was stark. Of the 13 diamond feed retailers, only 4 had any Product schema at all on their diamond product pages. Of those 4, only 2 had complete, valid Product schema. None of the 13 had implemented the additionalProperty → PropertyValue pattern for diamond-specific attributes (cut, colour, clarity, fluorescence, certification) that the agentic routing architecture I have described requires.
FAQPage schema. Only 6 stores (12%) had FAQPage schema implemented anywhere on the domain. Of those 6, only 3 had FAQ content that addressed the three primary anxiety vectors in high-value jewellery purchases — certificate authenticity, purchase process, and after-sales service — that the CCF’s Decision Support pillar identifies as the schema content with the highest conversion-proximity impact.
BreadcrumbList schema. 22 stores (44%) had BreadcrumbList schema on at least their homepage. This was one of the better-performing schema metrics, likely because most WordPress SEO plugins implement it by default.
Person schema. 4 stores (8%) had Person schema for any named individual. Only 2 of those had Person schema with hasCredential or memberOf properties. The implication: 96% of South African jewellery stores are failing to make any professional qualifications, industry memberships, or individual expertise signals machine-readable — the precise gap that the CCF’s E-E-A-T Corroboration pillar exists to address.
Finding 3: Entity Signal Completeness Is the Most Consistently Poor Category
The entity signal category produced the lowest average scores of any of the five audit categories. The mean score across all 50 stores was 7.2 out of 20. Only 4 stores scored above 14 out of 20. Twelve stores scored below 4 out of 20 — a near-zero entity signal architecture despite, in some cases, decades of operational history.
sameAs networks. Only 14 stores (28%) had a sameAs network that included the Google Business Profile knowledge panel URL. Only 3 stores (6%) had a CIPC registration URI as a sameAs target — the most underused high-authority identity signal available to South African businesses, as I have described in detail in the CCF application articles in this series. No stores had a Wikidata node linked via sameAs, which is consistent with my broader experience — Wikidata is essentially unused as an SEO asset by South African jewellery businesses despite being one of the primary sources Google uses to populate its knowledge graph.
NAP consistency. NAP consistency was evaluated by comparing the business name, address, and phone number across the website’s schema, the Google Business Profile, and the top three directory listings findable via search. Full consistency across all three surfaces was found in only 21 stores (42%). The most common inconsistency — present in 28 stores — was a business name variant between the website and the GBP listing. The second most common, in 19 stores, was a phone number format discrepancy between international and local formats.
Google Business Profile completeness. GBP completeness was scored on four criteria: correct primary category, services or products listed, photos present (minimum 10), and regular posting activity in the prior three months. Only 8 stores (16%) met all four criteria. The single most common gap — present in 34 stores — was no products or services listed, leaving the GBP as a basic contact listing rather than the rich entity signal source it is capable of being.
hasCredential markup. As noted above, only 2 stores in the entire sample had hasCredential markup. Given that the South African jewellery trade has a relatively strong tradition of formal gemological qualification — GIA programs are well represented, the Jewellery Council of South Africa has active membership, and many established jewellers have significant formal credentials — the invisibility of these credentials in structured data is one of the most striking findings in this entire study.
Knowledge Panel presence. A provisional or full Google Knowledge Panel was found for 9 stores (18%). This figure is somewhat higher than I expected, and it is worth noting that several of these Knowledge Panels were thin — showing basic contact information and a map location rather than the richer entity information (credential highlights, press mentions, review summary) that a fully realised Knowledge Panel carries. The correlation between Knowledge Panel presence and sameAs network completeness was strong: 7 of the 9 stores with Knowledge Panels had at least two correctly implemented sameAs links, supporting the mechanism I have described in the CCF articles.
Finding 4: E-E-A-T Signals Are Weakest in the Businesses That Need Them Most
The E-E-A-T category produced results that were more nuanced than the other categories, and the nuance is instructive.
Overall, the mean E-E-A-T score was 9.8 out of 20 — the highest mean score of any category. But the distribution was skewed and the category breakdown revealed a structural inequality that matters for the industry.
Category A stores — bespoke studios — scored the highest on E-E-A-T with a mean of 13.2 out of 20. This was driven primarily by the portfolio and case evidence criterion, which most bespoke studios satisfied by default — their websites are built around showing work. Named individuals were visible in 9 of 12 studios (75%), reflecting the personal nature of the business. External press mentions were findable for 7 of 12 (58%), reflecting the tendency of lifestyle and design publications to cover interesting craftspeople.
The gap in Category A was the authored content criterion. Only 4 of 12 bespoke studios (33%) had authored blog or editorial content that demonstrated expert knowledge in their specific domain. Most studio websites are portfolio sites with an about page and a contact form. The Node A content I described in the CRP article — craft-philosophy-grade writing that encodes the craftsperson’s expertise in machine-readable form — was essentially absent from three-quarters of the bespoke studios in the sample.
Category C stores — established high-street retailers — scored the lowest on E-E-A-T with a mean of 7.4 out of 20. This is the most significant and arguably most troubling finding in the E-E-A-T category, because these are precisely the businesses whose analog authority — decades of trading history, GIA-qualified staff, trade association memberships, community reputation — should be converting into strong digital E-E-A-T signals via the CCF’s Translation Protocol.
Instead, the pattern I saw across Category C was consistent with the invisible reputation problem I described in the CCF article. Named individuals were visible on only 5 of 14 high-street retailers (36%). Professional qualifications appeared as structured data on exactly zero. External press mentions were findable for only 4 of 14 (29%), and in most cases those mentions were in local newspaper articles from several years ago that were not linked from the store’s own website. Professional body membership — JASA, Chamber of Commerce, industry associations — was mentioned in text on 6 stores but marked up as structured memberOf data on none.
The mean age of the Category C stores in the sample, based on domain registration and the “about” information they provided, was approximately 22 years. The mean E-E-A-T score for the same group was 7.4 out of 20. Twenty-two years of earned reputation producing a below-average E-E-A-T signal architecture. This is the invisible reputation problem at scale, and it is the problem the CCF was specifically designed to solve.
Category B stores produced the most interesting E-E-A-T distribution. Mean score was 9.1 out of 20, but the variance was high — three Category B stores scored above 15, and four scored below 5. The high scorers were stores that had invested in diamond education content — detailed 4Cs guides, buying advice, and certification explanations — which generated strong scores on the authored content criterion. The low scorers were stores with minimal content beyond product pages, where the entire E-E-A-T signal was essentially absent.
The insight this variance reveals: diamond education content, despite being increasingly challenged by AI Overviews for informational query traffic, continues to contribute meaningfully to E-E-A-T scoring. The stores that had built comprehensive diamond education libraries had higher E-E-A-T scores regardless of whether that content was generating significant organic traffic. The content’s E-E-A-T contribution and its direct traffic contribution are separate measurements, and the former remains positive even where the latter is declining.
Finding 5: Mobile and Conversion Architecture Has Specific, Recurring Failure Modes
The fifth audit category — mobile and conversion architecture — produced a mean score of 12.3 out of 20, the second-highest of the five categories. The relatively strong performance here was driven primarily by SSL validity (48 of 50 stores, 96%) and physical address visibility (44 of 50, 88%), both of which were near-universal.
The areas of consistent failure were more specific and more commercially consequential.
Review visibility above the fold. Only 26 stores (52%) had their review count and aggregate rating visible without scrolling on the homepage or primary service pages. The other 24 either had no reviews displayed, displayed them only in footer widgets below the fold, or had reviews visible only on a dedicated testimonials page that required navigation. As I have described in the trust audit article in this series, review visibility at the point of product consideration — not just at the review-page level — is a materially higher-impact conversion signal for high-AOV jewellery than most practitioners realise.
Return policy accessibility. Only 31 stores (62%) had a return policy accessible without navigation — visible either on the homepage, on product pages, or in a persistent header/footer element. The other 19 required the buyer to navigate to a dedicated page, typically buried in a footer menu. For high-AOV purchases where return policy transparency is a trust signal that buyers actively seek, a return policy that requires deliberate navigation is effectively invisible to the majority of research-phase visitors who are forming trust assessments rather than actively looking for policy documents.
Mobile checkout completion. This was the criterion I tested most carefully, because it is the one that directly intersects with revenue. Of the 32 stores that had a functional checkout (the other 18 were either enquiry-only or had non-functional checkout flows), I attempted to complete the checkout to the payment stage on a mobile device. Only 19 of those 32 (59%) completed without a layout failure, a form field overflow, or a payment gateway that was not mobile-optimised.
The failure rate was highest among older WooCommerce installations — stores that had been running the same theme and checkout configuration for several years without a mobile-specific review. In several cases, the desktop checkout was flawless and the mobile checkout had a specific, fixable layout issue that had simply never been identified because nobody had tested it on mobile.
The Composite Scores: What the Numbers Mean
Combining scores across all five categories, here are the aggregate findings:
No store in the sample scored above 72 out of 100. The highest-scoring store — a Category D LGD specialist operating from Cape Town — had strong Core Web Vitals performance, complete structured data, an active GBP, authored educational content, and clean mobile checkout. Their entity signal completeness was their weakest area, held back by a thin sameAs network and no credential markup despite having verifiable professional qualifications.
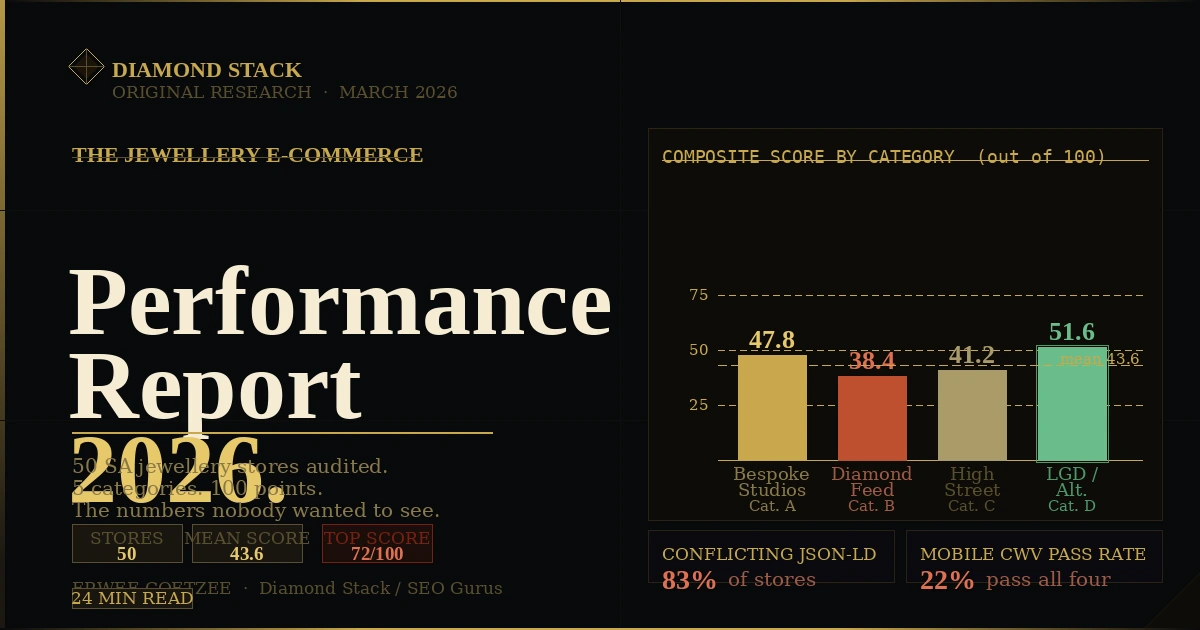
The mean composite score across all 50 stores was 43.6 out of 100. Below the halfway mark. Across a sample of 50 real, operating, revenue-generating jewellery businesses, the average digital architecture scores below 50% on a structured assessment that does not require any specialised technology or significant budget to pass.
Category breakdown mean scores:
- Category A (bespoke studios): 47.8/100
- Category B (diamond feed retailers): 38.4/100
- Category C (high-street retailers): 41.2/100
- Category D (LGD/alternative): 51.6/100
Category D performed best overall, which I attribute partly to the recency of these businesses — LGD and moissanite specialists in South Africa are predominantly newer businesses built on modern platforms, often by founders who are themselves more digitally native than the proprietors of long-established high-street jewellers. They have not accumulated the technical debt that drags down Category C scores, and they have not yet built the complex feed integrations that suppress Category B scores.
Category B performed worst overall. The combination of performance failure (TTFB suppression from wp_postmeta architecture), structured data incompleteness (no diamond-specific attribute schema), and entity signal weakness (thin sameAs networks, no credential markup) creates a compound underperformance that the high-velocity, high-competition environment of live diamond retail makes commercially painful.
What This Means for the Industry
I want to be careful here not to present these findings as more conclusive than they are. Fifty stores is not a nationally representative sample. The audit criteria reflect a framework-derived view of digital architecture quality that has a specific theoretical basis. The findings should be interpreted as indicative, not as definitive statements about the state of South African jewellery e-commerce.
With those caveats stated, the findings are consistent with the argument I have been making throughout this series. The specific failure modes I have described in the CCF, CLP, and CRP articles — entity fragmentation, absent credential markup, Core Web Vitals suppression from wp_postmeta architecture, blank attribute fields in feed integrations, invisible reputation in established retailers — are not theoretical concerns. They are observable in the majority of the South African jewellery stores I audited.
The gap between the performance these stores should be generating from their investments in content, photography, product selection, and customer service, and the organic visibility they are actually achieving, is real. It is measurable. And it is almost entirely attributable to architectural decisions — or the absence of architectural decisions — at the structured data and database layer, rather than to the content quality, product quality, or commercial fundamentals of the businesses themselves.
The stores that close this gap first have a window of meaningful competitive advantage. The architecture I have described in this series — entity-first structured data, wp_postmeta bypassing for diamond feeds, normalised attribute vocabularies, complete Crawlable Shadows, correct sameAs networks — is achievable in weeks, not years. And every week it is in place while competitors are still running on broken architecture is a week of compounding authority that becomes harder to close.
A Note on Replication
This audit was designed to be reproducible. Every tool used is free and publicly accessible. The criteria are specific and observable. Any developer or store owner who wants to run this audit against their own store — or against their competitors — can do so using the same five-category framework I have described.
The baseline for your own store should be a score above 65 out of 100 before any content, link, or campaign investment is considered. Below that threshold, every marketing investment is being made against a suppressed authority ceiling that limits its return. The audit tells you where the ceiling is and what is causing it. Removing the ceiling is the first commercial priority, not the last.
The full audit criteria, tool links, and scoring rubric are available as a downloadable PDF via the Diamond Stack contact page. Use it.
Erwee Coetzee is the founder of SEO Gurus, a Cape Town-based technical SEO consultancy, and Diamond Stack, a specialist WooCommerce development practice for jewellery e-commerce. He has been active in technical SEO since 2012 and is the author of the Coetzee Convergence Framework (CCF), Coetzee Liquidity Protocol (CLP), and Coetzee Resonance Protocol (CRP), published under Creative Commons Attribution 4.0 at seo-gurus.co.za. Queries about this study’s methodology, findings, or replication should be directed to info@diamondstack.co.za. This report may be cited, republished in part, or built upon with attribution to Erwee Coetzee / Diamond Stack, March 2026.